Monitor pipeline status
Track replication status, view logs, and troubleshoot issues.
Private Alpha
Supabase Pipelines is currently in private alpha. Private alpha features can be unstable and may introduce breaking changes while we evaluate the product direction, refine the feature set, and incorporate customer feedback.
After setting up Pipelines, you can monitor the status and health of your replication pipelines directly from the Dashboard. The pipeline is the active Postgres replication process that continuously streams changes from your database to your destination.
Viewing pipeline status#
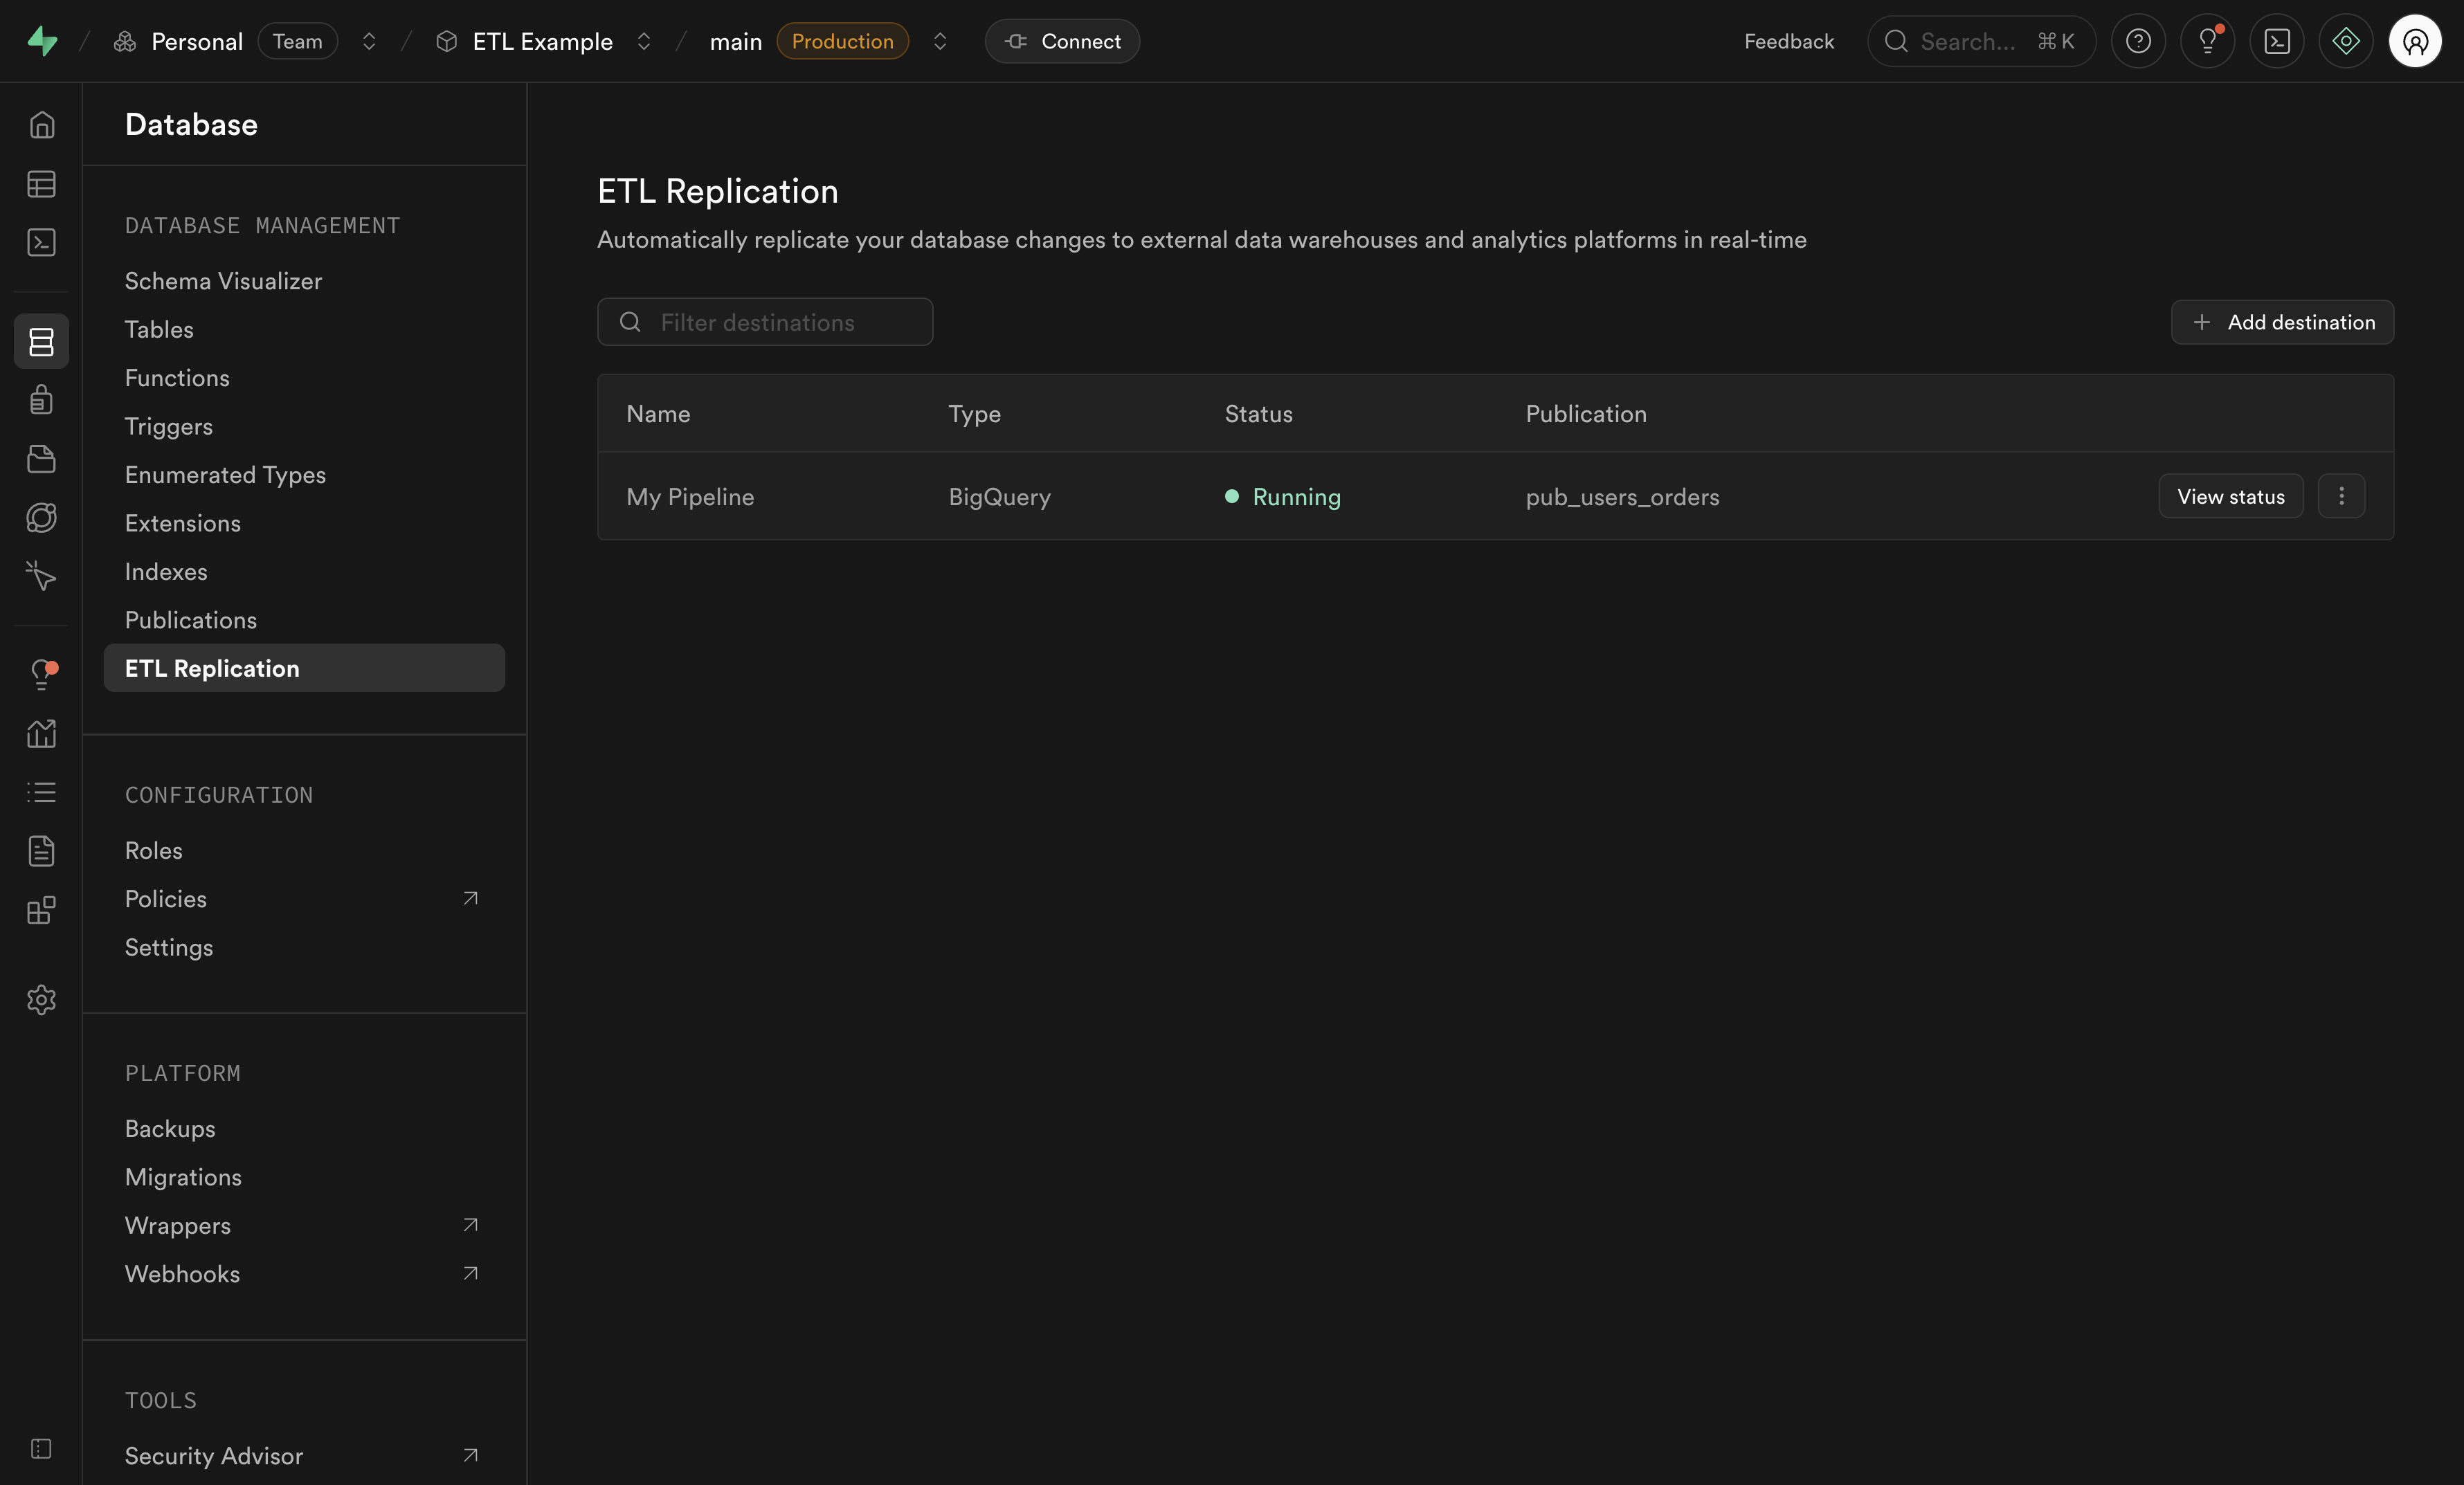
To monitor your replication pipelines:
- Navigate to the Database > Replication section of the Dashboard
- You'll see a list of all your destinations with their pipeline status
Pipeline states#
Each destination shows its pipeline in one of these states:
Viewing detailed pipeline metrics#
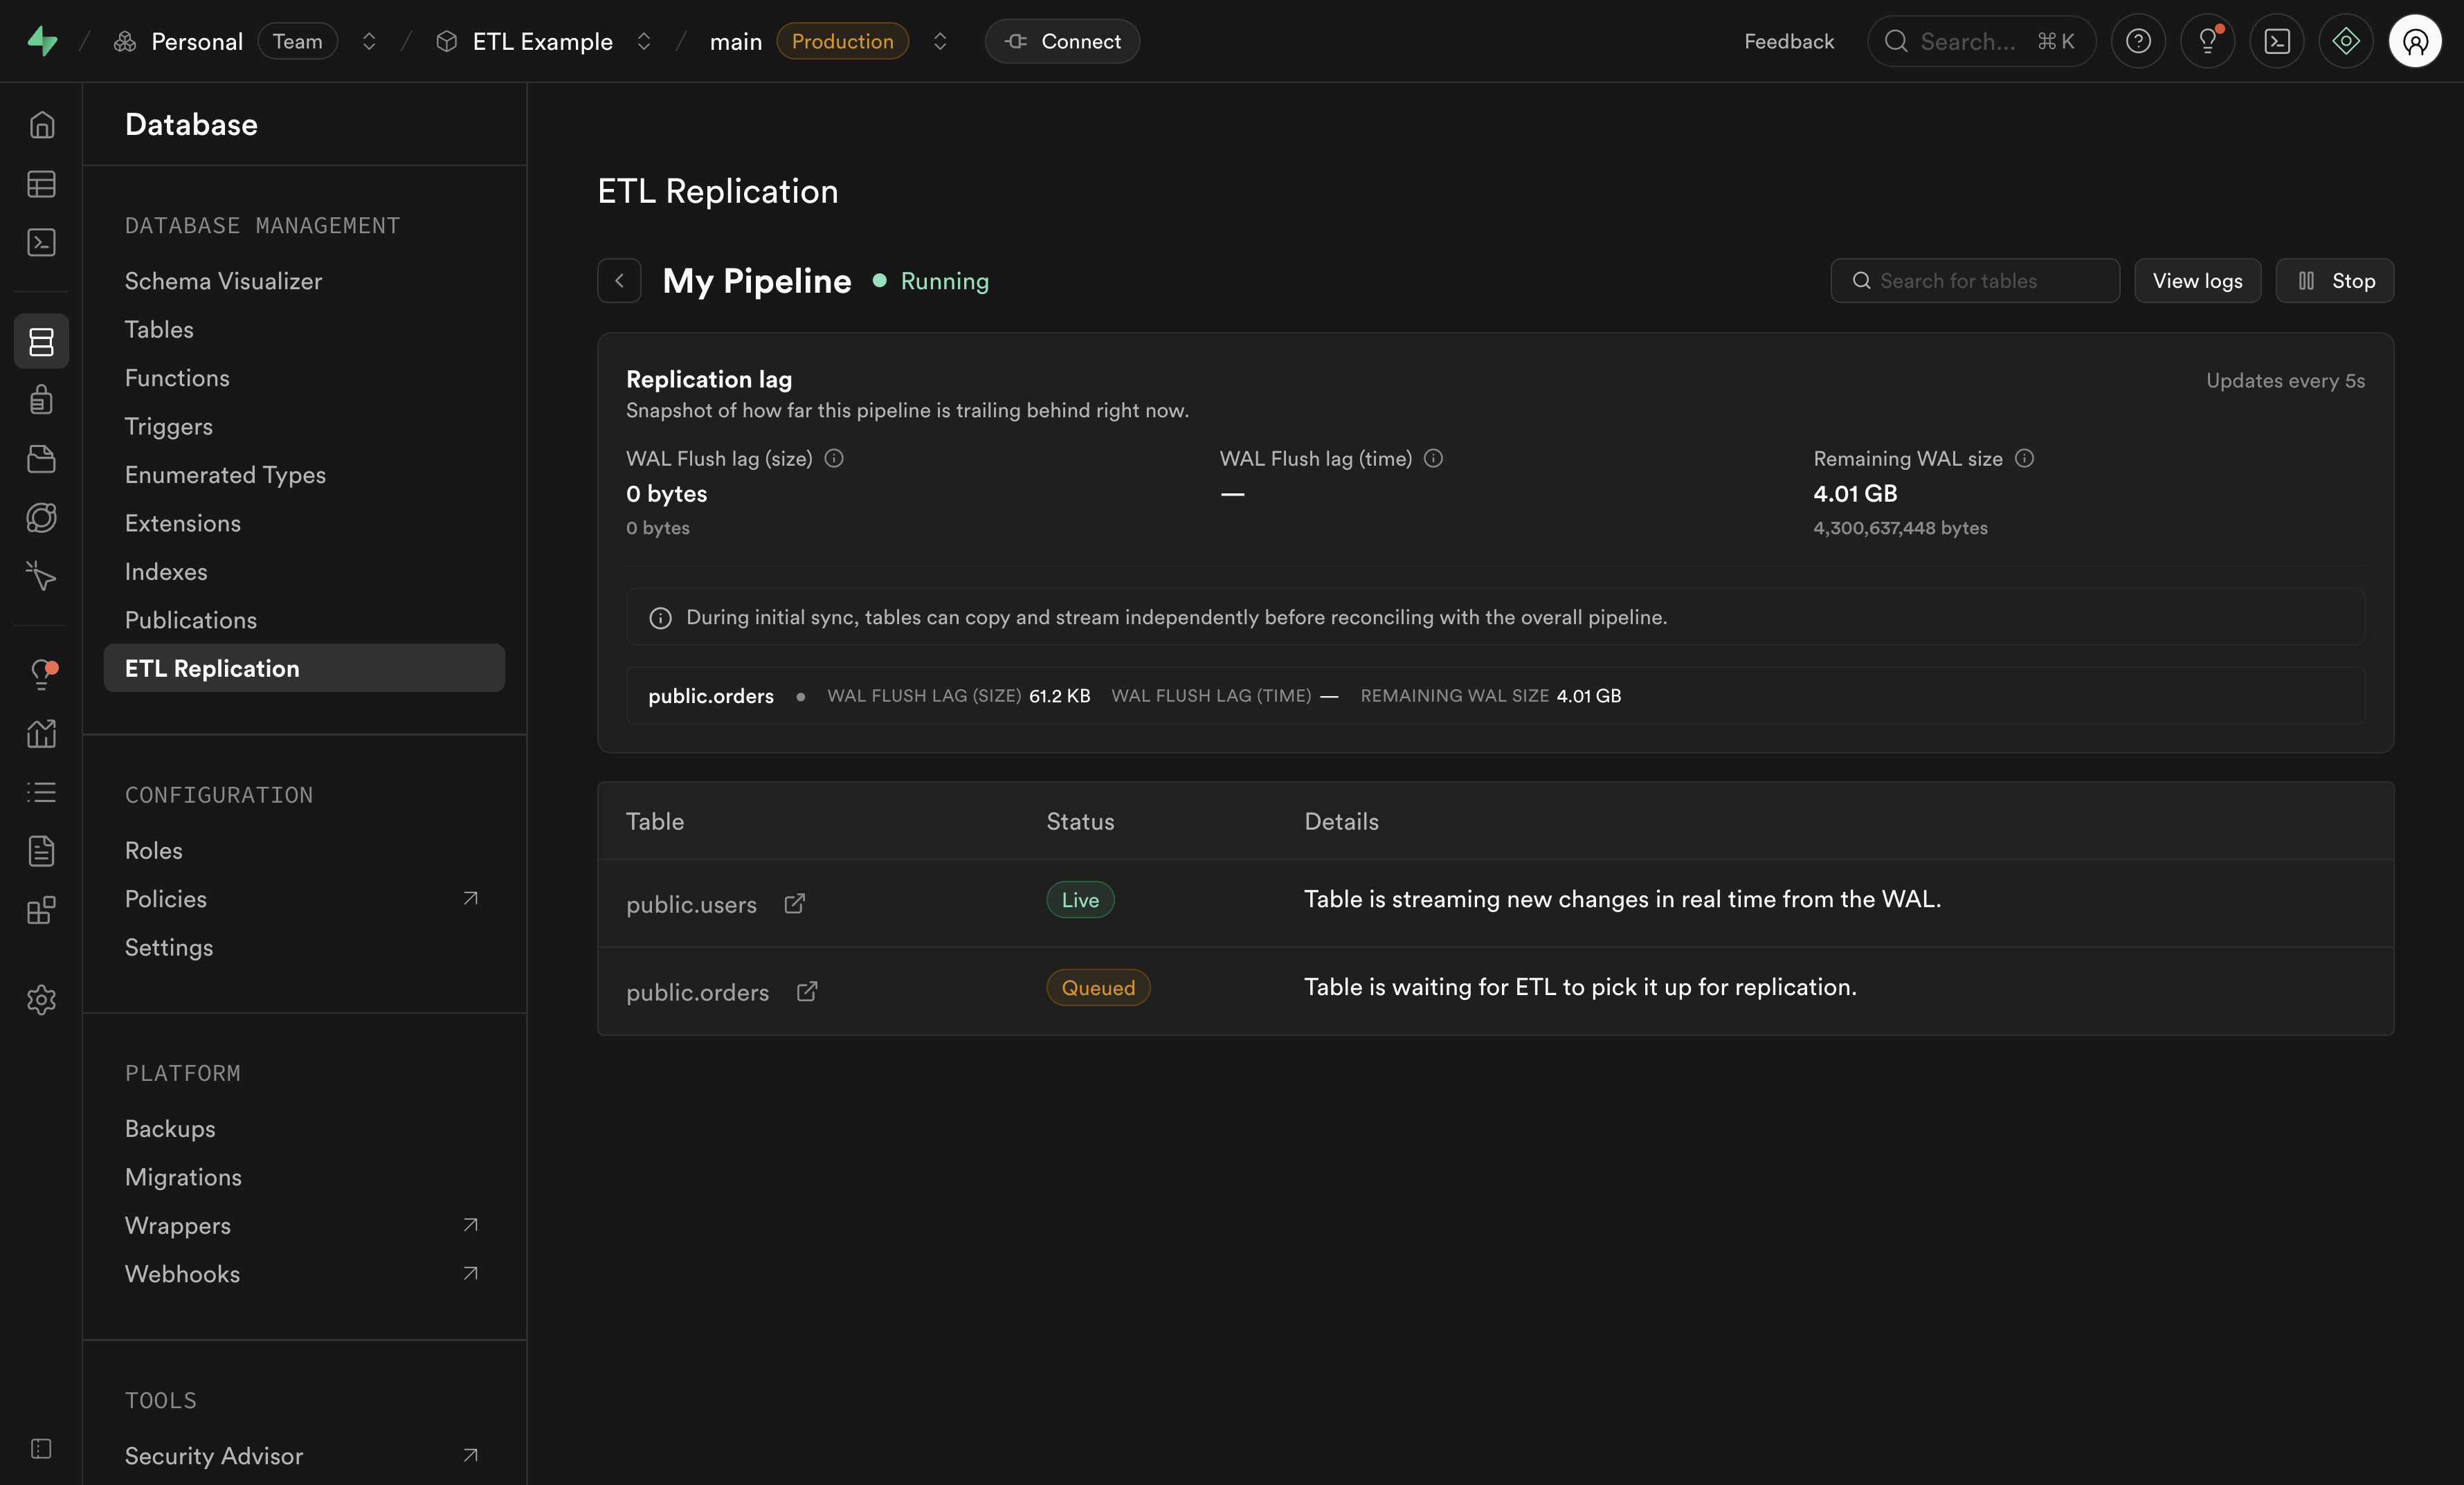
For detailed information about a specific pipeline, click View pipeline on the destination. This opens the pipeline status page where you can monitor replication performance and table states.
Replication lag metrics#
The status page shows replication lag metrics that help you determine how far the pipeline is behind Postgres. These metrics are loaded directly from Postgres replication slot state.
The destinations list also shows a compact lag value. This value is byte-based: it shows how much WAL the pipeline has not confirmed as flushed yet. A value of Caught up means the pipeline has confirmed every change currently available for its slot.
The detailed status page shows:
Pipelines uses one main pipeline replication slot for ongoing changes. During the initial copy phase, it can also create temporary table-sync replication slots. These temporary slots let multiple tables copy in parallel, make large table copies faster, and allow individual tables to be retried or copied again without restarting the whole pipeline.
Temporary table-sync slots show the same kind of lag and slot health metrics while they are active. After a table finishes copying and catches up, its temporary slot is removed and ongoing changes continue through the main pipeline slot. For overall replication health, focus first on the main pipeline slot.
Slot statuses#
Replication slot status tells you whether Postgres is still retaining the WAL that the pipeline needs to continue from its current position.
Table states#
The pipeline status page also shows the state of individual tables being replicated. Each table can be in one of these states:
Dealing with replication lag#
Replication lag means the pipeline is behind the source database. Some lag is expected during the initial copy phase, after a burst of writes, or after restarting a stopped pipeline. Lag becomes a problem when it keeps increasing, when Room before pausing is running low, or when the slot status moves to Unreserved or Lost.
Lag can come from several places:
- Destination throughput: The destination is slow, rate-limited, unavailable, or rejecting writes.
- Pipeline throughput: The pipeline is overloaded, processing a very large transaction, or not performing as expected for the project workload.
- Source database activity: Postgres is producing WAL faster than the pipeline can consume it, often during bulk writes, migrations, or backfill jobs.
- Network latency: Latency or instability between the pipeline and source database can slow down WAL streaming.
- Stopped or disconnected pipeline: When a pipeline is stopped, disconnected, or failed, Postgres keeps WAL for the slot until the retention limit is reached.
- Slow initial table copy: A temporary table-sync slot can fall behind if a table is copied more slowly than new changes are written to that table.
Initial copy and table-sync slots#
A common initial sync issue happens when a large or busy table is still in Copying while new rows keep being inserted or updated. The temporary table-sync slot needs to keep the changes that happen during the copy. If the copy is too slow compared to the table's write rate, the slot can move to Unreserved and then Lost if Postgres removes changes the copy still needs.
When a table-sync slot is lost, the affected table needs to be copied again. Tune the copy settings, then retry the table copy:
- Increase Copy connections per table when one large table is the bottleneck. This lets the pipeline copy chunks of that table in parallel, up to the point where the source database or network becomes the limit.
- Increase Table sync workers when several tables need to copy at the same time. Each worker can copy one table, and each worker uses an additional temporary replication slot during initial sync.
- If possible, run the initial copy during a quieter write period or reduce bulk writes until the table reaches Live.
After the affected table finishes copying and catches up, the temporary slot is deleted. The table then continues through the main pipeline replication slot.
Investigate the lag#
- Open Database > Replication and check the destination's lag column.
- Click View pipeline and check Waiting to sync, Room before pausing, Last check-in, Connected, and Slot status.
- Check table states. Tables in Copying can create temporary lag while the initial snapshot catches up to live changes. If a table-sync slot is Unreserved or Lost, tune copy parallelism and retry the affected table copy.
- Open Logs > Replication and look for destination errors, retries, rate limits, schema errors, or repeated restarts.
- Compare the lag trend with recent database activity, such as imports, migrations, bulk updates, or long transactions.
Respond based on the slot status#
Reduce future lag risk#
- Keep publications focused on the tables and operations you need at the destination.
- Avoid leaving pipelines stopped for long periods while the source database is still receiving writes.
- Schedule bulk updates, imports, and migrations during lower-traffic windows when possible.
- For BigQuery, verify that service account permissions, table requirements, and replica identity settings match the BigQuery destination guide.
- If the initial copy is the bottleneck, review Table sync workers and Copy connections per table in the pipeline's advanced settings. Increasing them can speed up copying, but it uses more database connections and replication slots.
Handling errors#
Errors can occur at two levels: per table or per pipeline.
Table errors#
Table errors occur during the copy phase and affect individual tables. These errors can be retried without stopping the entire pipeline.
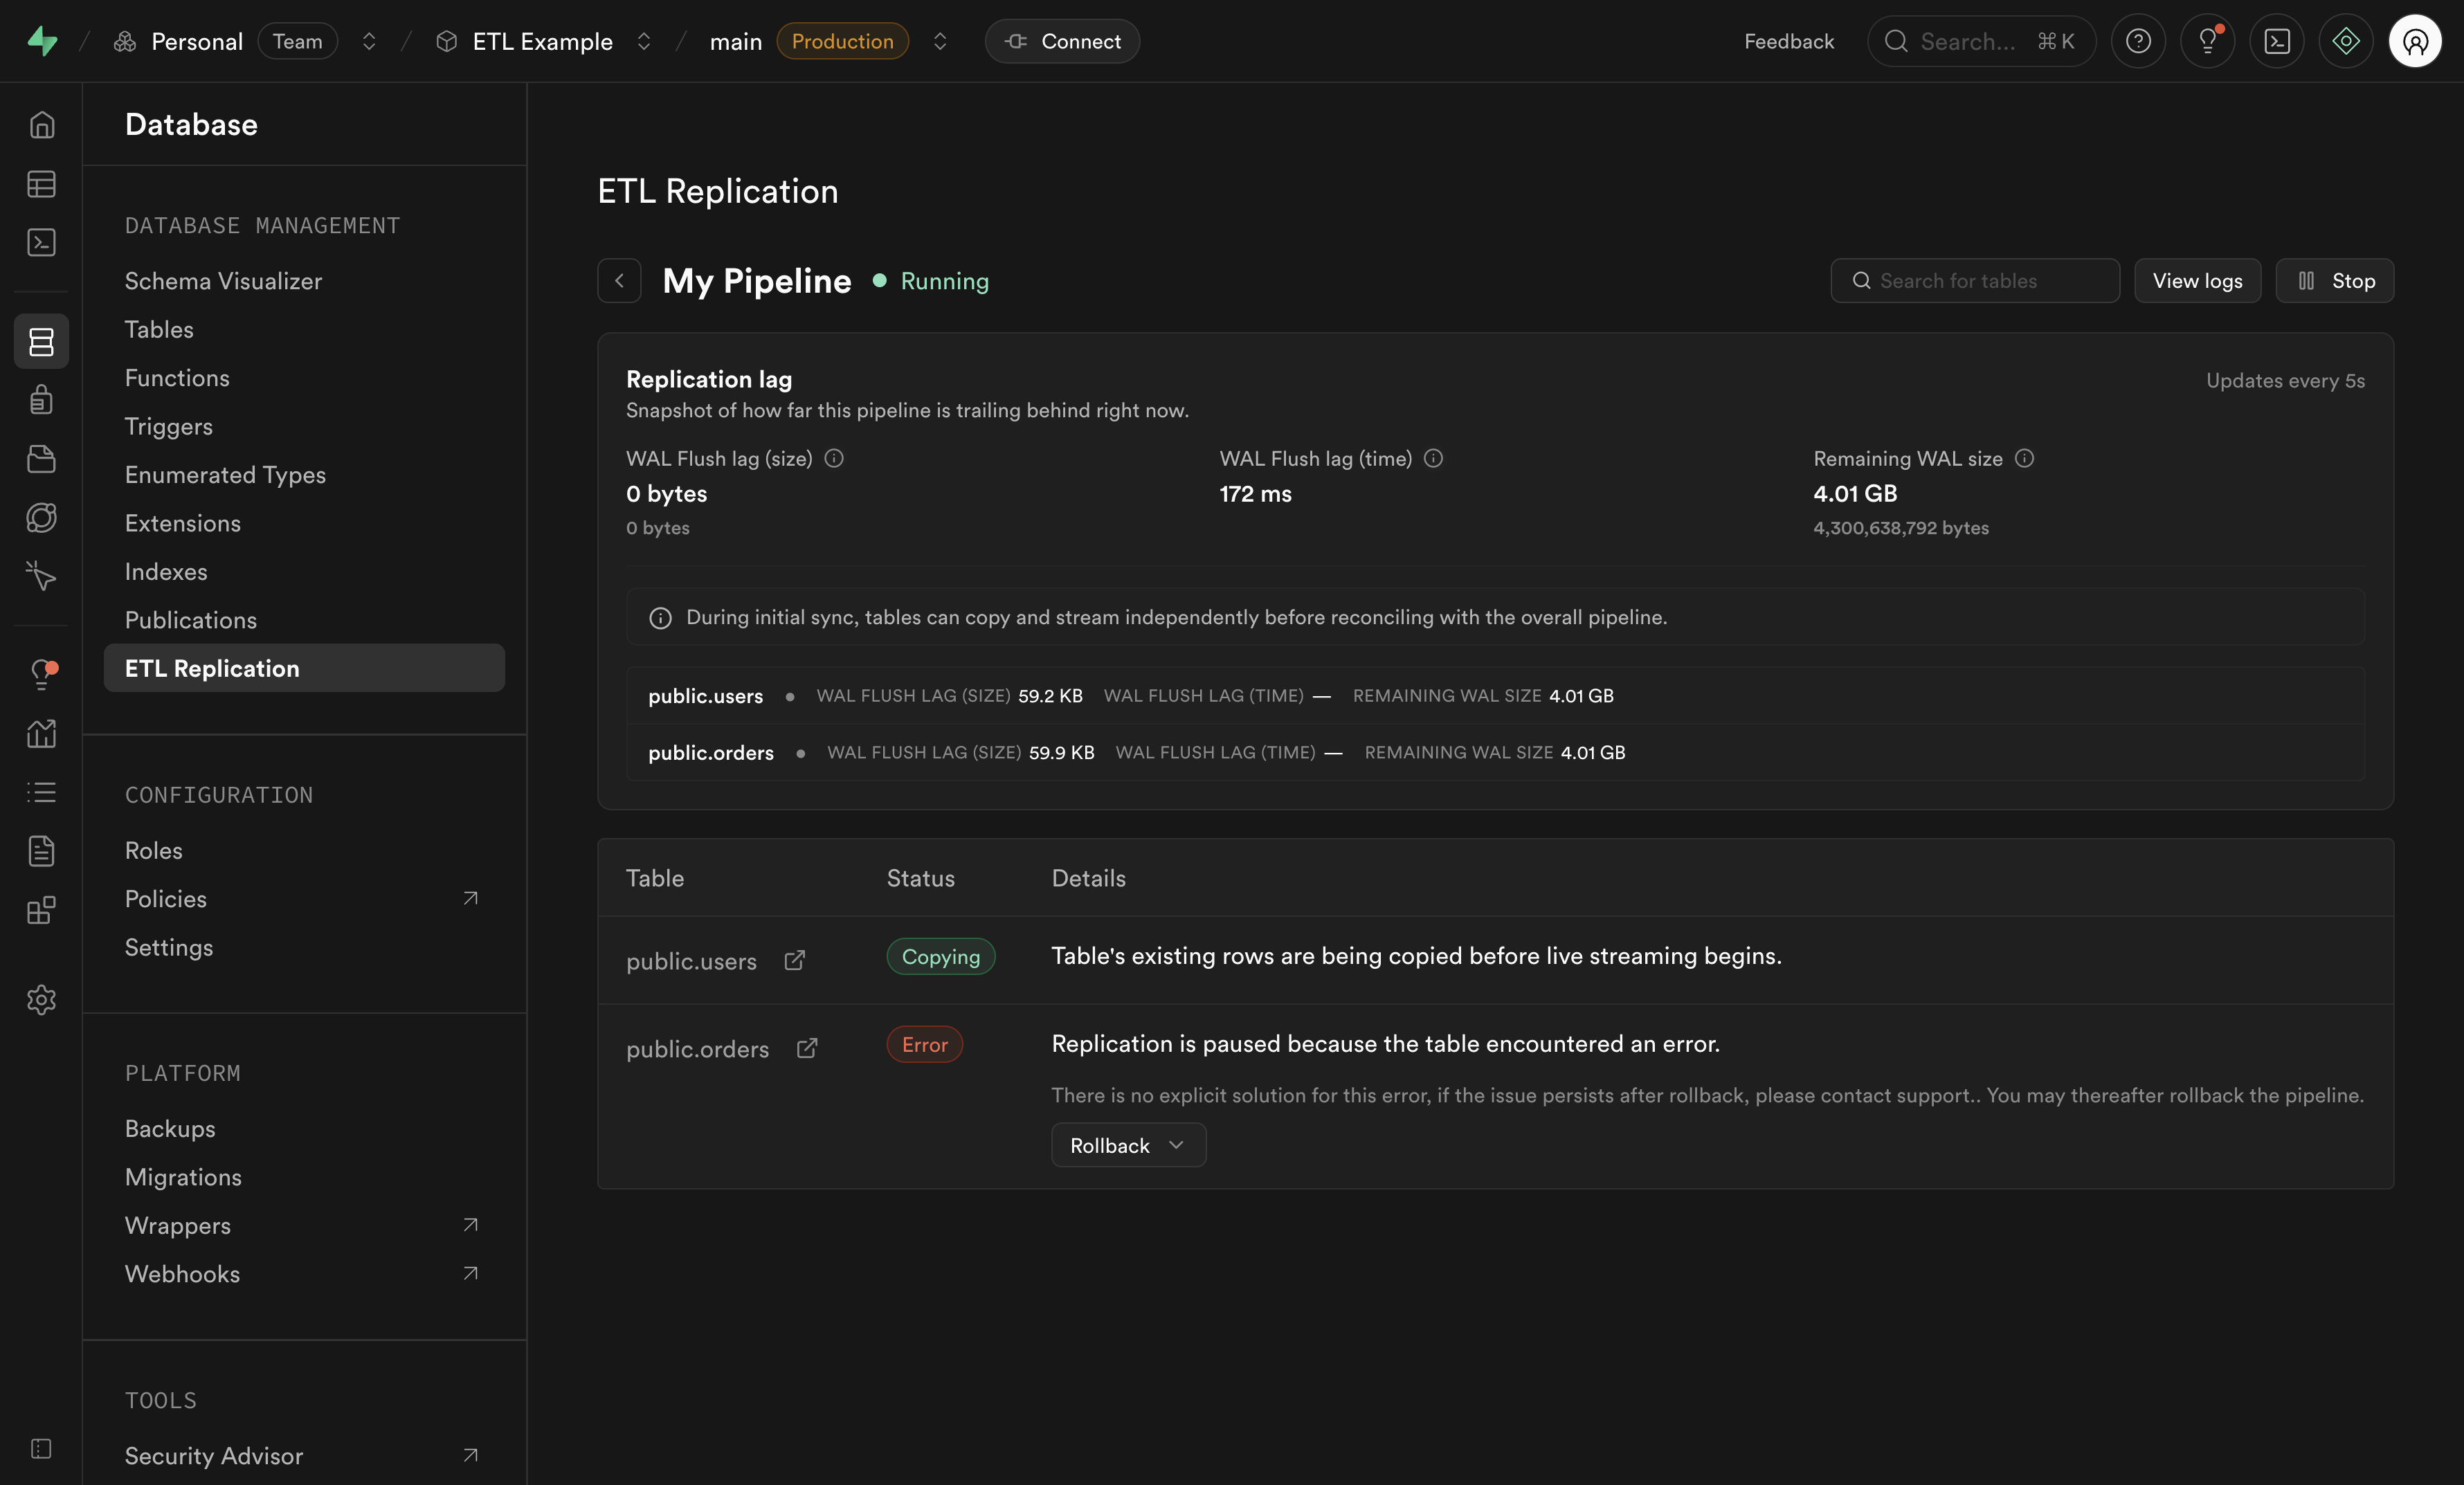
Viewing table error details:
- Click View pipeline on your destination
- Check the table states section to identify tables in Error state
- Review the error message for that specific table
Recovering from table errors:
When a table encounters an error during the copy phase, you can reset the table state. This will restart the table copy from the beginning.
Pipeline errors#
Pipeline errors occur during the streaming phase (Live state) and affect the entire pipeline. When streaming data, if an error occurs, the entire pipeline will stop and enter a Failed state. This prevents data loss by ensuring no changes are skipped.
When a pipeline error occurs, you'll receive an email notification immediately. This ensures you're promptly notified of any issues so you can take action to resolve them.
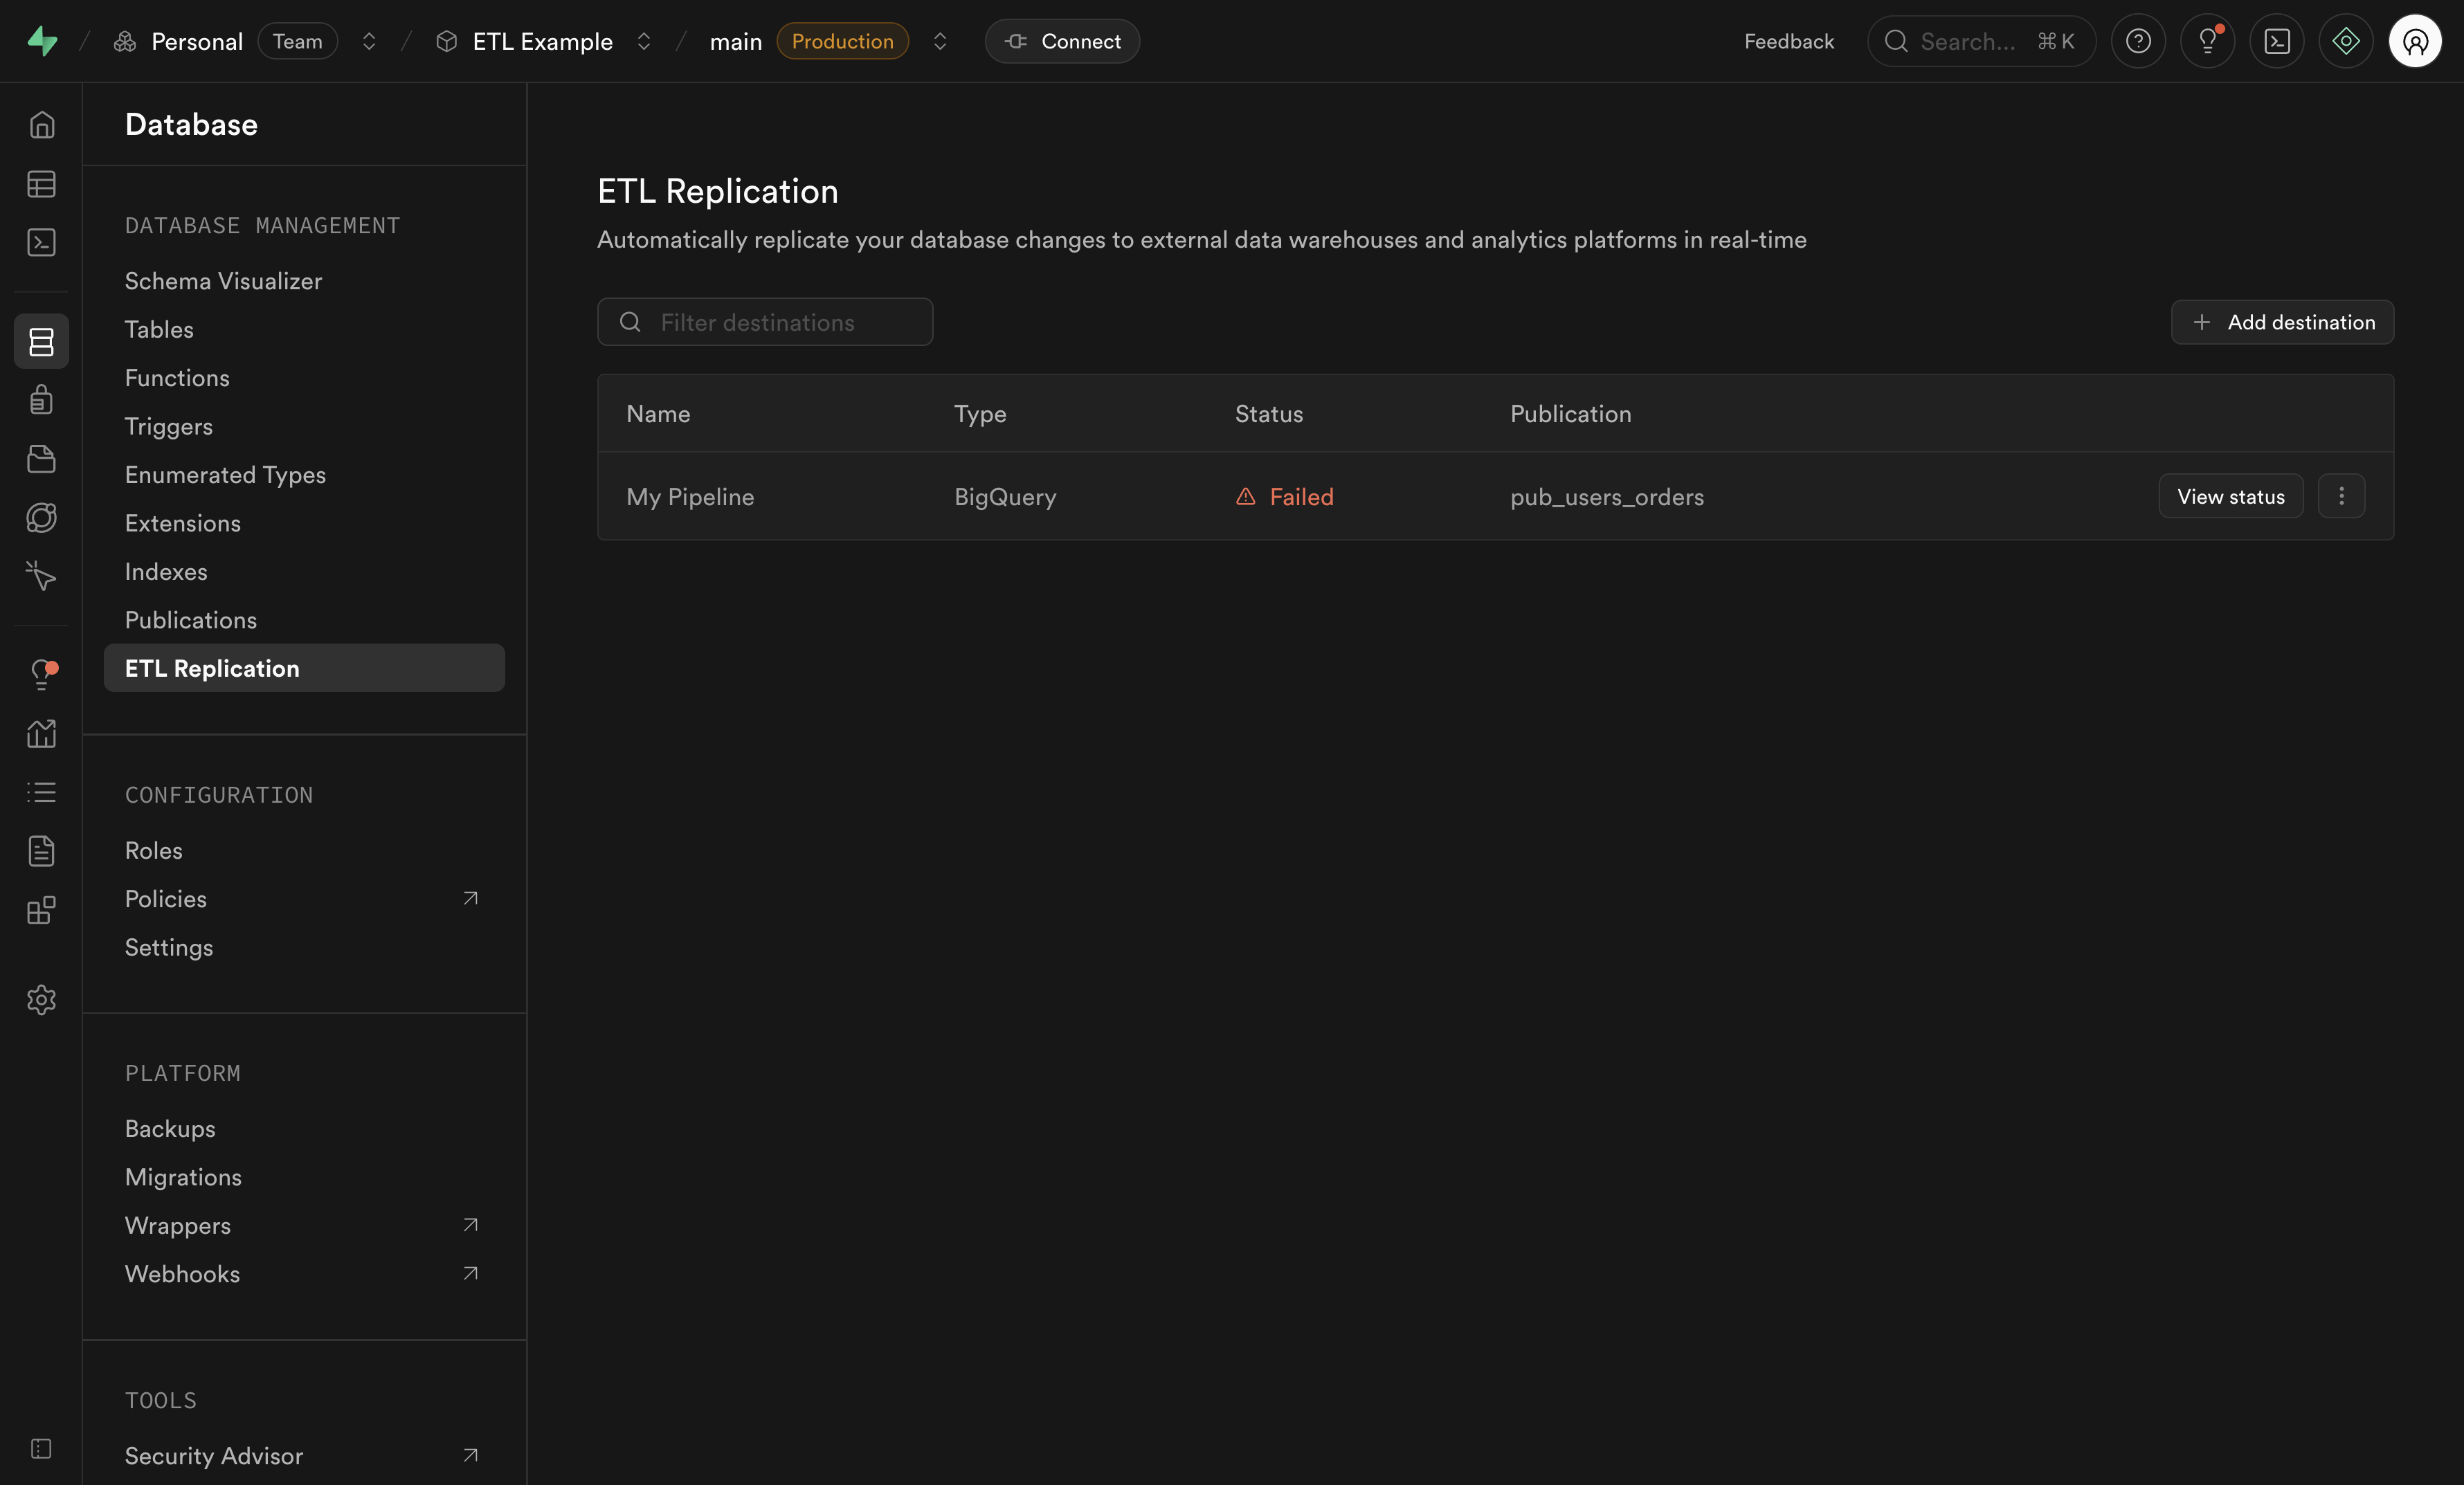
Viewing pipeline error details:
- Hover over the Failed status in the destinations list to see a quick error summary
- Click View pipeline for comprehensive error information
- Navigate to the Logs > Replication section of the Dashboard for detailed error logs
Recovering from pipeline errors:
To recover from a pipeline error, you'll need to:
- Investigate the root cause using the error details and logs
- Fix the underlying issue (e.g., destination connectivity, schema compatibility)
- Restart the pipeline from the destinations list
Viewing logs#
To see detailed logs for all your replication pipelines:
- Navigate to the Logs > Replication section of the Dashboard
- Select Replication from the log source filter
- You'll see all logs from your replication pipelines
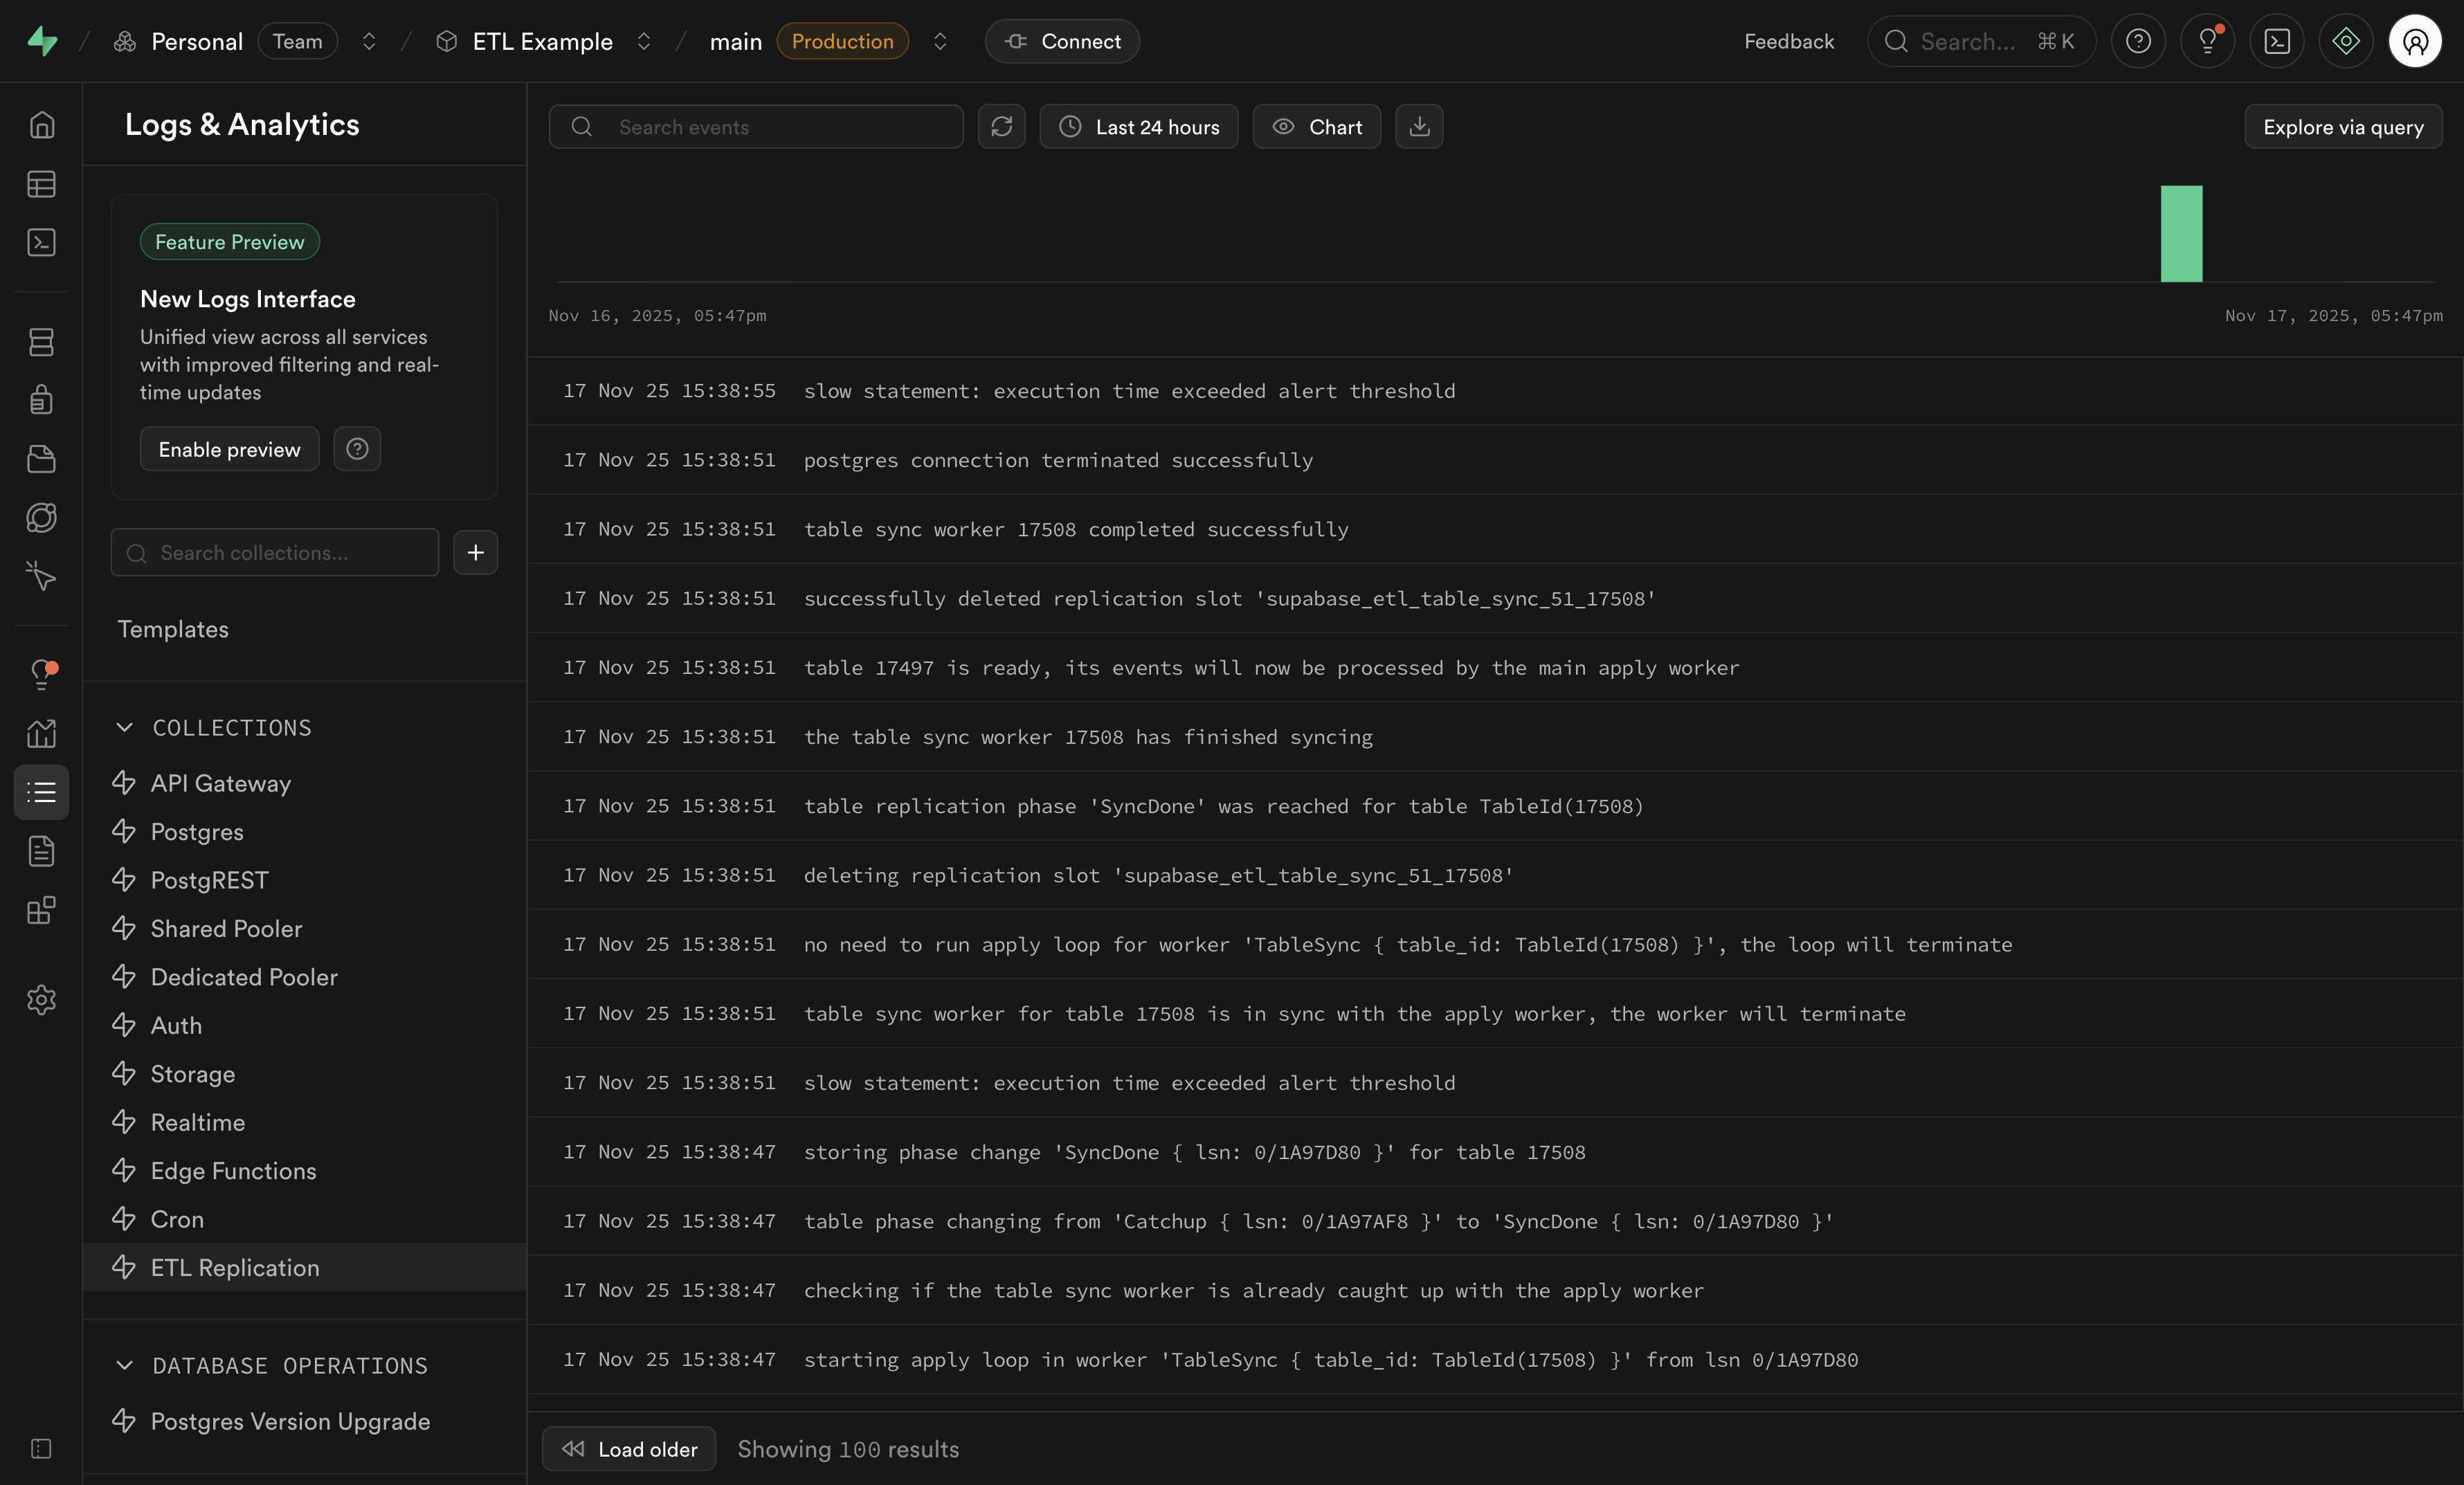
Logs contain diagnostic information that may be too technical for most users. If you're experiencing issues with replication, reaching out to support with your error details is recommended.
Common monitoring scenarios#
Checking if replication is healthy#
- Navigate to the Database > Replication section of the Dashboard
- Verify your destination shows a "Running" status
- Click View pipeline to check replication lag and table states
- Ensure all tables show a "Live" state
Investigating errors#
If you see a Failed status:
- Hover over the status to see the error summary
- Click View pipeline to see detailed error information
- Check table states to identify which tables are affected
- Navigate to the Logs > Replication section of the Dashboard for full error details
- For table errors, attempt to reset the affected tables
Monitoring performance#
To ensure optimal performance:
- Regularly check replication lag metrics in the pipeline status view
- Monitor table states to ensure tables are staying in a "Live" state
- Review logs for warnings or performance issues
- If lag is consistently high, review your publication and destination configuration
Troubleshooting#
If you notice issues with your replication:
- Check pipeline state: Ensure the pipeline is in Running state
- Review table states: Identify tables in Error state
- Check logs: Navigate to the Logs > Replication section of the Dashboard for detailed error information
- Verify publication: Ensure your Postgres publication is properly configured
- Monitor replication lag: High lag may indicate performance issues
For more troubleshooting tips, see the Pipelines FAQ.