Logging
Monitor your Edge Functions with logging to track execution, debug issues, and optimize performance.
Logs are provided for each function invocation, locally and in hosted environments.
Accessing logs#
Production#
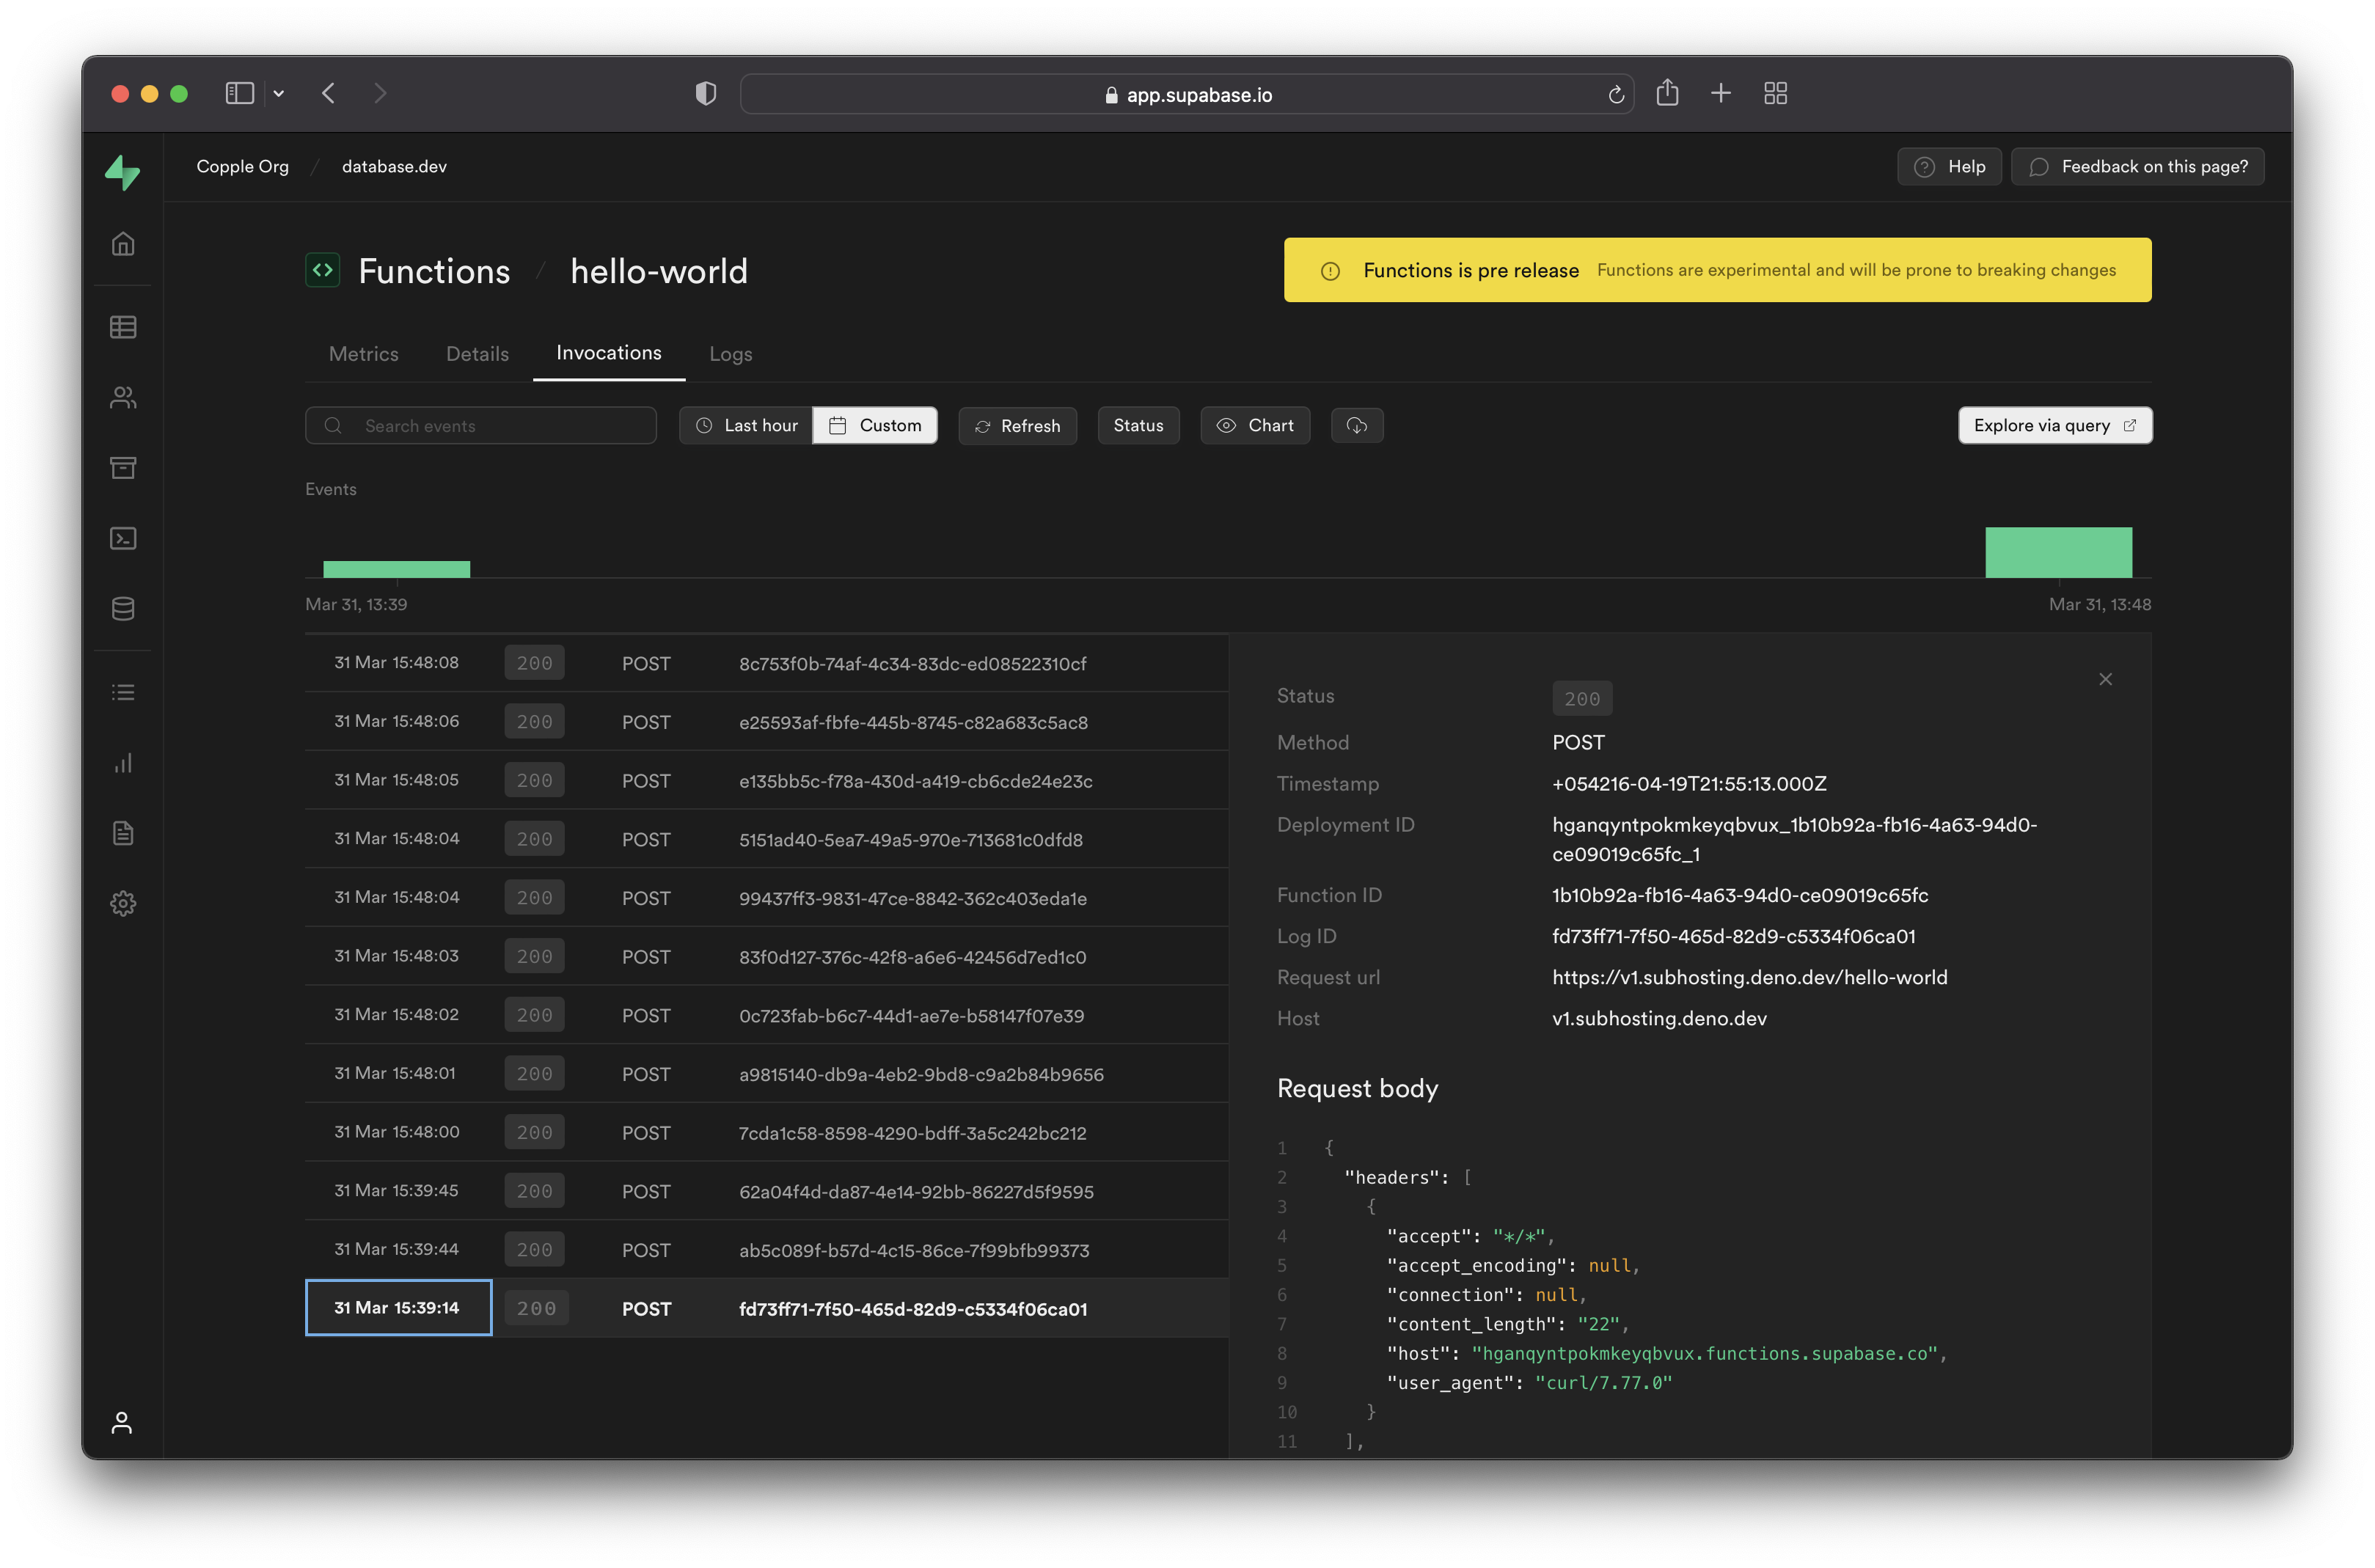
Access logs from the Functions section of your Dashboard:
- Navigate to the Functions section of the Dashboard
- Select your function from the list
- Choose your log view:
- Invocations: Request/Response data including headers, body, status codes, and execution duration. Filter by date, time, or status code.
- Logs: Platform events, uncaught exceptions, and custom log messages. Filter by timestamp, level, or message content.
Development#
When developing locally you will see error messages and console log statements printed to your local terminal window.
Log event types#
Automatic logs#
Your functions automatically capture several types of events:
- Uncaught exceptions: Uncaught exceptions thrown by a function during execution are automatically logged. You can see the error message and stack trace in the Logs tool.
- Custom log events: You can use
console.log,console.error, andconsole.warnin your code to emit custom log events. These events also appear in the Logs tool. - Boot and Shutdown Logs: The Logs tool extends its coverage to include logs for the boot and shutdown of functions.
Custom logs#
You can add your own log messages using standard console methods:
1Deno.serve(async (req) => {2 try {3 const { name } = await req.json()45 if (!name) {6 // Log a warning message7 console.warn('Empty name parameter received')8 }910 // Log a message11 console.log(`Processing request for: ${name}`)1213 const data = {14 message: `Hello ${name || 'Guest'}!`,15 }1617 return new Response(JSON.stringify(data), {18 headers: { 'Content-Type': 'application/json' },19 })20 } catch (error) {21 // Log an error message22 console.error(`Request processing failed: ${error.message}`)23 return new Response(JSON.stringify({ error: 'Internal Server Error' }), {24 status: 500,25 headers: { 'Content-Type': 'application/json' },26 })27 }28})A custom log message can contain up to 10,000 characters. A function can log up to 100 events within a 10 second period.
Logging tips#
Logging request headers#
When debugging Edge Functions, a common mistake is to try to log headers to the developer console via code like this:
1// ❌ This doesn't work as expected23Deno.serve(async (req) => {4 console.log(`Headers: ${JSON.stringify(req.headers)}`) // Outputs: "{}"5})The req.headers object appears empty because Headers objects don't store data in enumerable JavaScript properties, making them opaque to JSON.stringify().
Instead, you have to convert headers to a plain object first, for example using Object.fromEntries.
1// ✅ This works correctly2Deno.serve(async (req) => {3 const headersObject = Object.fromEntries(req.headers)4 const headersJson = JSON.stringify(headersObject, null, 2)56 console.log(`Request headers:\n${headersJson}`)7})This results in something like:
1Request headers: {2 "accept": "*/*",3 "accept-encoding": "gzip",4 "authorization": "Bearer eyJhbGciOiJIUzI1NiIsInR5cCI6IkpXVCJ9.eyJpc3MiOiJzdXBhYmFzZSIsInJlZiI6InN1cGFuYWNobyIsInJvbGUiOiJhbm9uIiwieW91IjoidmVyeSBzbmVha3ksIGh1aD8iLCJpYXQiOjE2NTQ1NDA5MTYsImV4cCI6MTk3MDExNjkxNn0.cwBbk2tq-fUcKF1S0jVKkOAG2FIQSID7Jjvff5Do99Y",5 "cdn-loop": "cloudflare; subreqs=1",6 "cf-ew-via": "15",7 "cf-ray": "8597a2fcc558a5d7-GRU",8 "cf-visitor": "{\"scheme\":\"https\"}",9 "cf-worker": "supabase.co",10 "content-length": "20",11 "content-type": "application/x-www-form-urlencoded",12 "host": "edge-runtime.supabase.com",13 "my-custom-header": "abcd",14 "user-agent": "curl/8.4.0",15 "x-deno-subhost": "eyJ0eXAiOiJKV1QiLCJhbGciOiJIUzI1NiIsImtpZCI6InN1cGFiYXNlIn0.eyJkZXBsb3ltZW50X2lkIjoic3VwYW5hY2hvX2M1ZGQxMWFiLTFjYmUtNDA3NS1iNDAxLTY3ZTRlZGYxMjVjNV8wMDciLCJycGNfcm9vdCI6Imh0dHBzOi8vc3VwYWJhc2Utb3JpZ2luLmRlbm8uZGV2L3YwLyIsImV4cCI6MTcwODYxMDA4MiwiaWF0IjoxNzA4NjA5MTgyfQ.-fPid2kEeEM42QHxWeMxxv2lJHZRSkPL-EhSH0r_iV4",16 "x-forwarded-host": "edge-runtime.supabase.com",17 "x-forwarded-port": "443",18 "x-forwarded-proto": "https"19}