Reports
Supabase Reports provide comprehensive observability for your project through dedicated monitoring dashboards for servers:
- Database
- Auth
- Storage
- Realtime
- API systems
Each report offers self-debugging tools to gain actionable insights for optimizing performance and troubleshooting issues.
Reports are only available for projects hosted on the Supabase Cloud platform and are not available for self-hosted instances.
Using reports#
You can filter reports by time range to focus on a specific period. Higher-tier plans provide access to longer time ranges.
API gateway#
The API Gateway report analyzes performance and traffic patterns managed by your project's API layer.
Auth#
The Auth reports focus on user authentication patterns and behaviors within your Supabase project.
Auth API Gateway#
The Auth API Gateway reports focus on API requests related to authentication and user management.
Database#
The Database report provides a comprehensive view into your Postgres instance's health and performance characteristics. These charts help you identify performance bottlenecks and resource constraints at a glance.
The following charts are available for Free and Pro plans:
Advanced Telemetry#
The following charts provide a more advanced and detailed view of your database performance and are available only for Team, Enterprise, and Platform plans.
Memory usage#
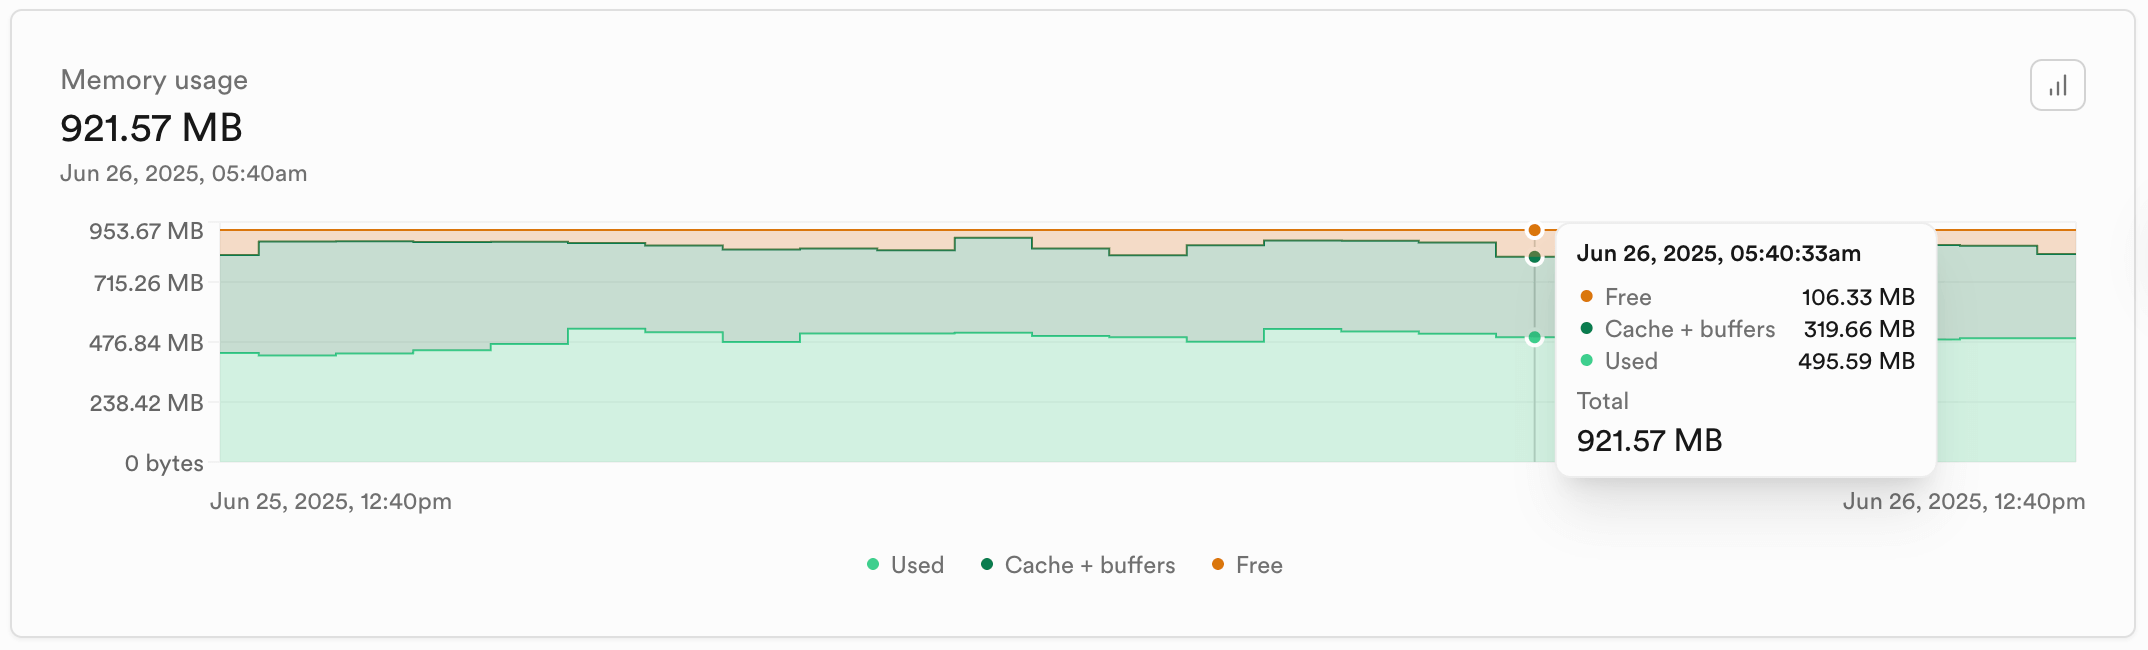
The Swap series only appears when the system is swapping. Swap is disk space the operating system uses as an overflow when physical RAM is full. Because disk is much slower than RAM, sustained swap activity indicates memory pressure and can significantly degrade database performance.
How it helps debug issues:
Actions you can take:
Memory commitment#
The Memory commitment chart shows how much memory the Linux kernel has promised to processes (Committed_AS) against the maximum it is willing to promise (CommitLimit). It is a leading indicator of out-of-memory risk that is not visible on the Memory usage chart.
Memory is committed when a process asks the kernel for an allocation (for example via malloc, a stack growth, or mmap). The kernel records the promise immediately, but only assigns physical pages when a page is first written. Committed memory is therefore the sum of every outstanding promise across every process, regardless of whether those pages have been touched yet.
How to read it:
Why this matters for Postgres:
- Each new connection is a
fork()of the postmaster, which inflates Committed_AS by roughly the size ofshared_buffersuntil copy-on-write pages diverge. Connection bursts can therefore blow past the Commit limit long before physical memory is exhausted. - Each query can allocate up to
work_memper sort or hash node. A handful of expensive concurrent queries can push commit far above what the Memory usage chart reports as "used". - When the kernel cannot honor its promises, the OOM killer terminates a process. On a database server that is usually a Postgres backend or, worse, the postmaster, which takes the whole database down.
Actions you can take:
CPU usage#
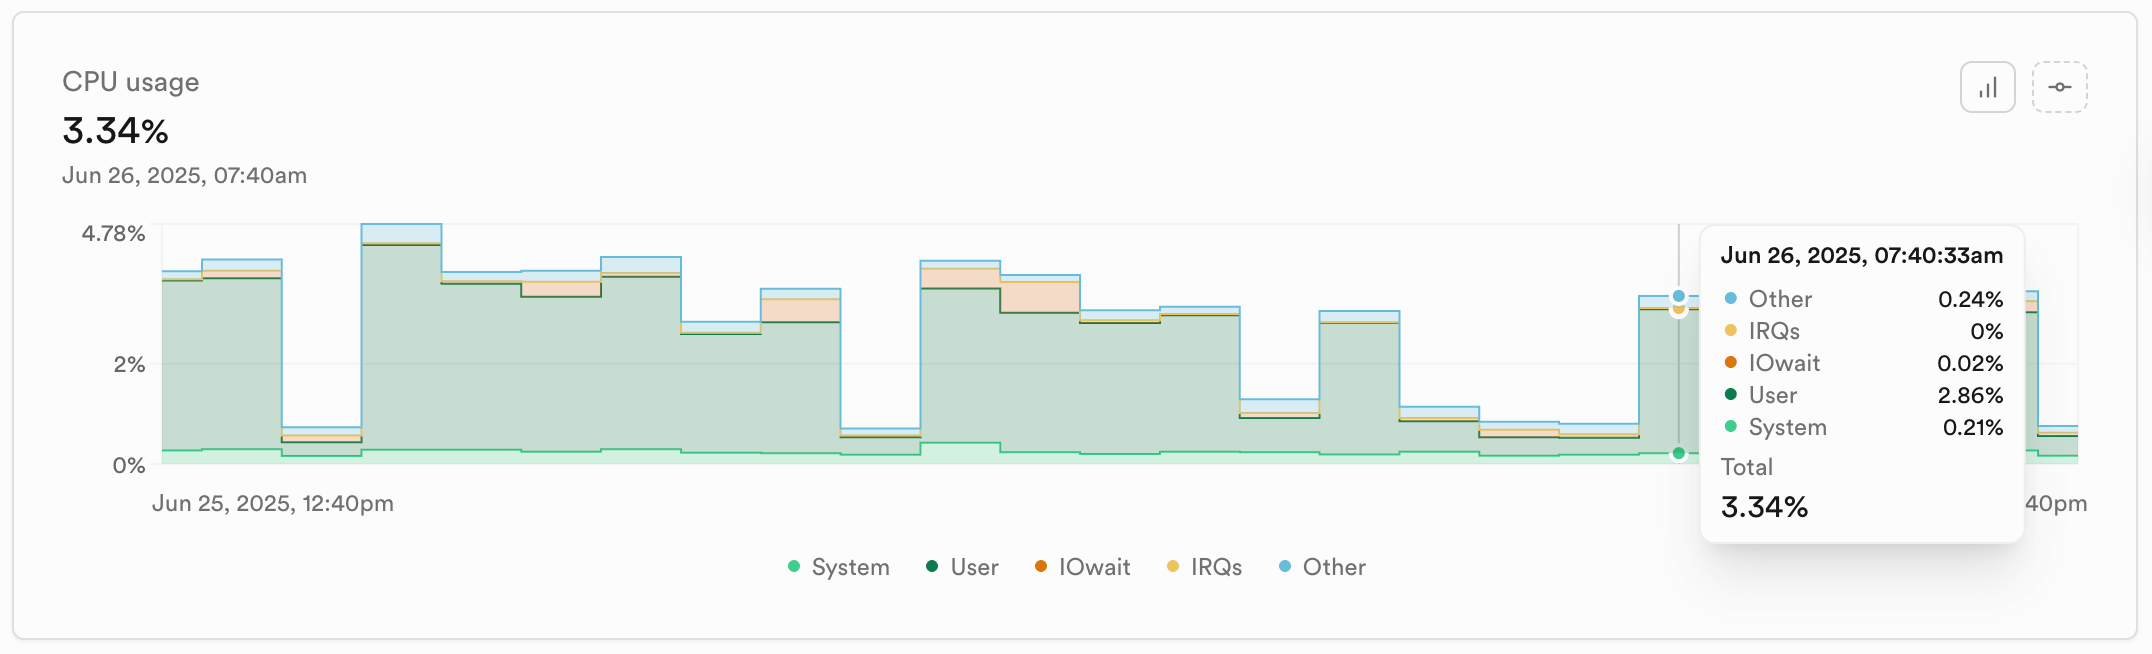
How it helps debug issues:
Actions you can take:
Disk input/output operations per second (IOPS)#
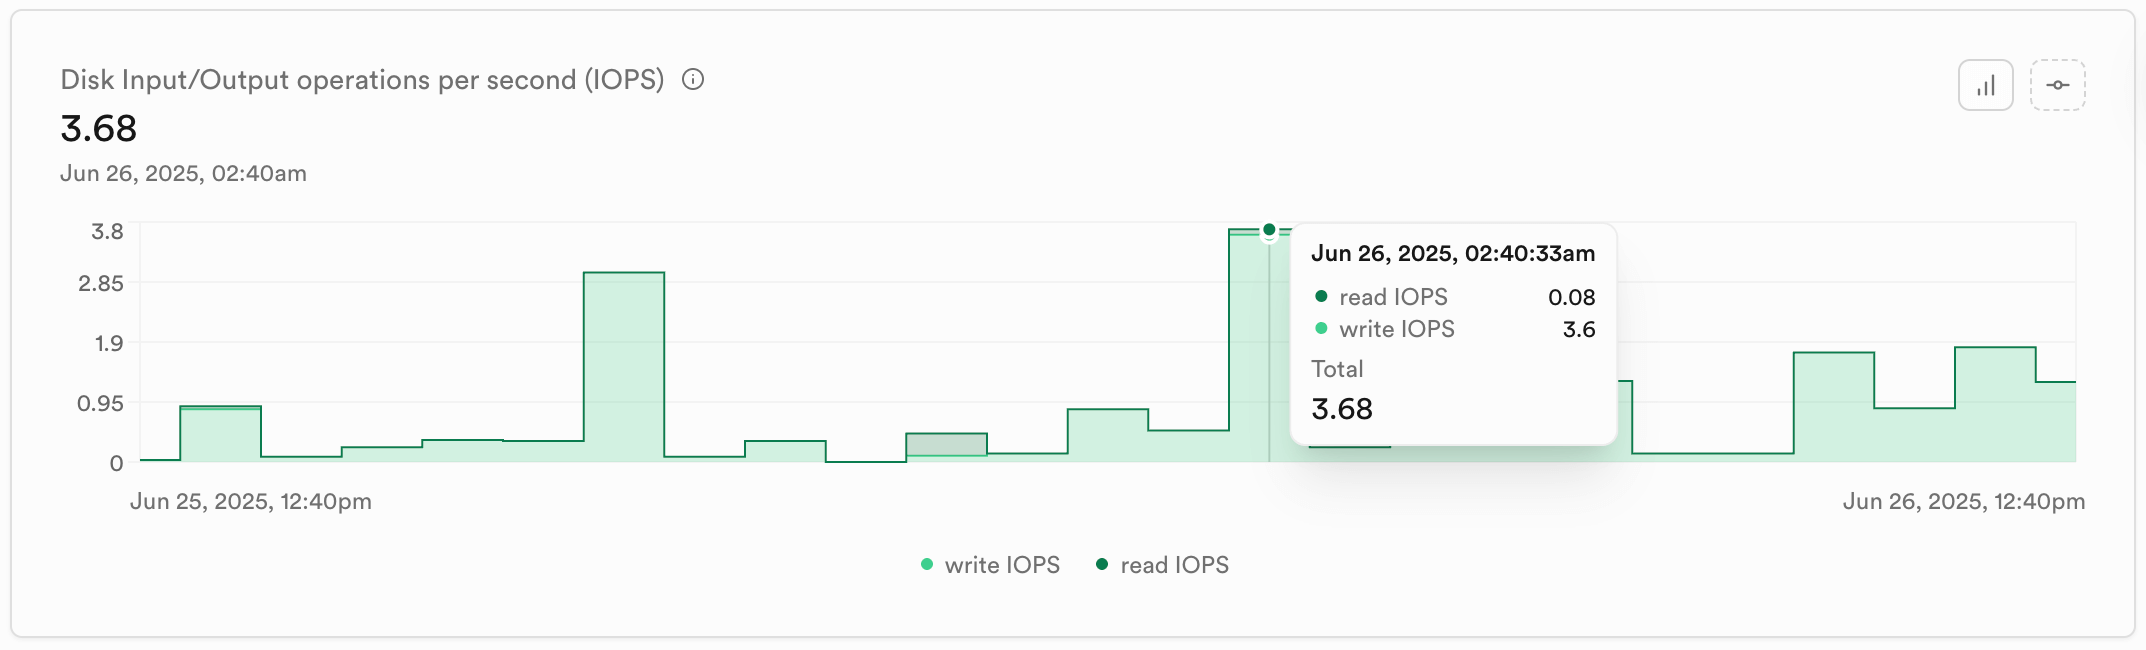
This chart displays read and write IOPS with a reference line showing your compute size's maximum IOPS capacity.
How it helps debug issues:
Actions you can take:
Disk throughput#
Available on Team and Enterprise plans.
This chart displays read and write throughput (bytes per second) with a reference line showing your compute size's maximum disk throughput.
How it helps debug issues:
Actions you can take:
Disk size#
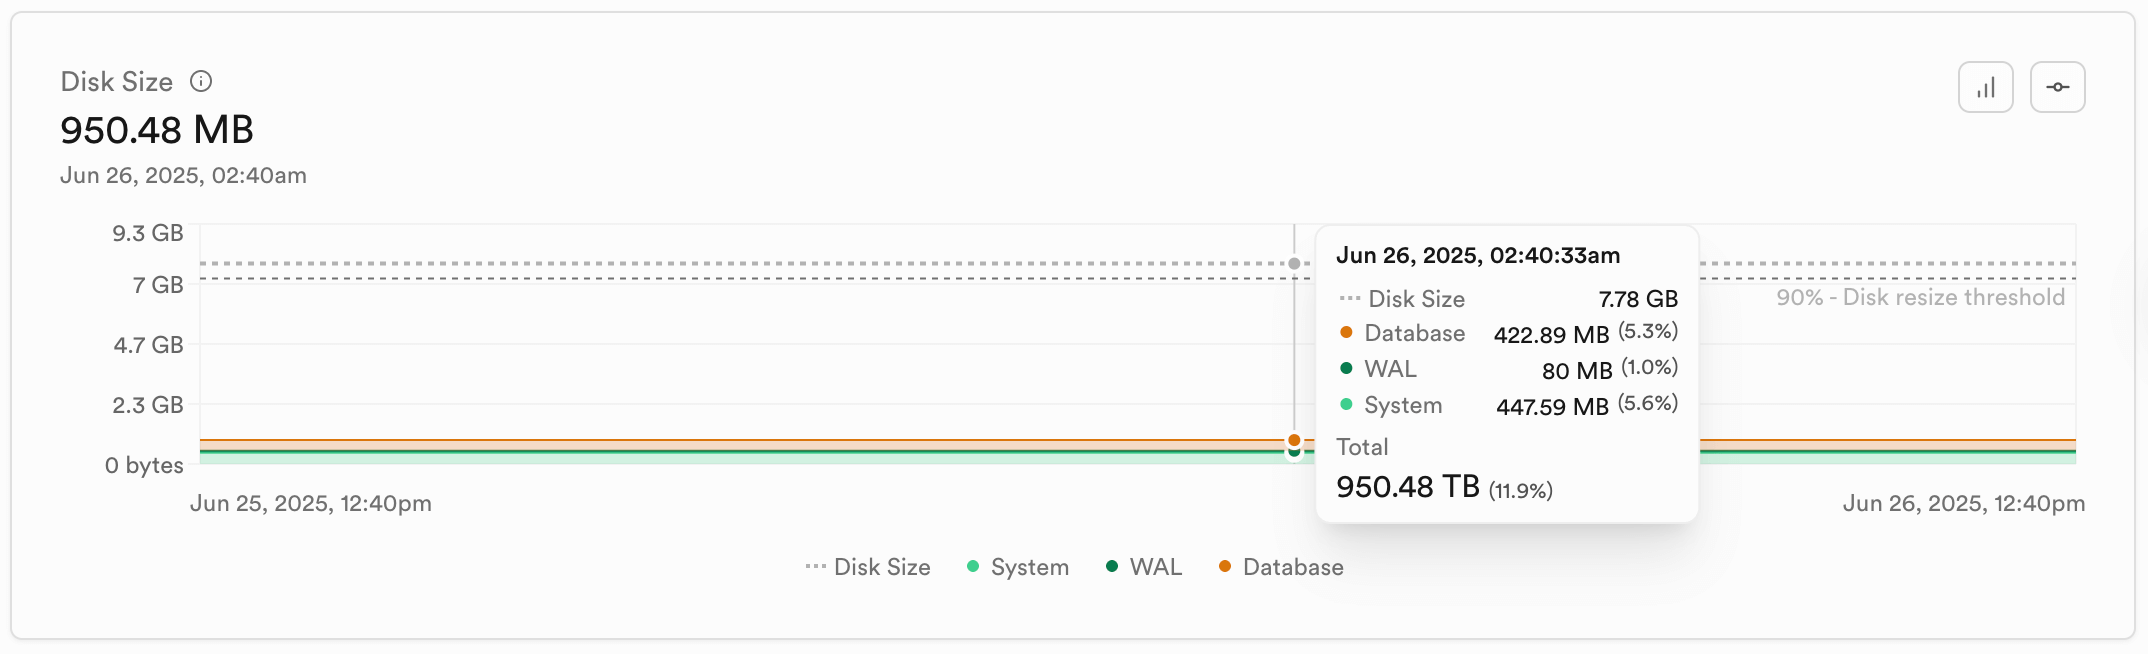
How it helps debug issues:
Actions you can take:
Query Performance#
Links to the Query Performance Advisory page in the dashboard, which provides a detailed analysis of slow database queries
Database connections#
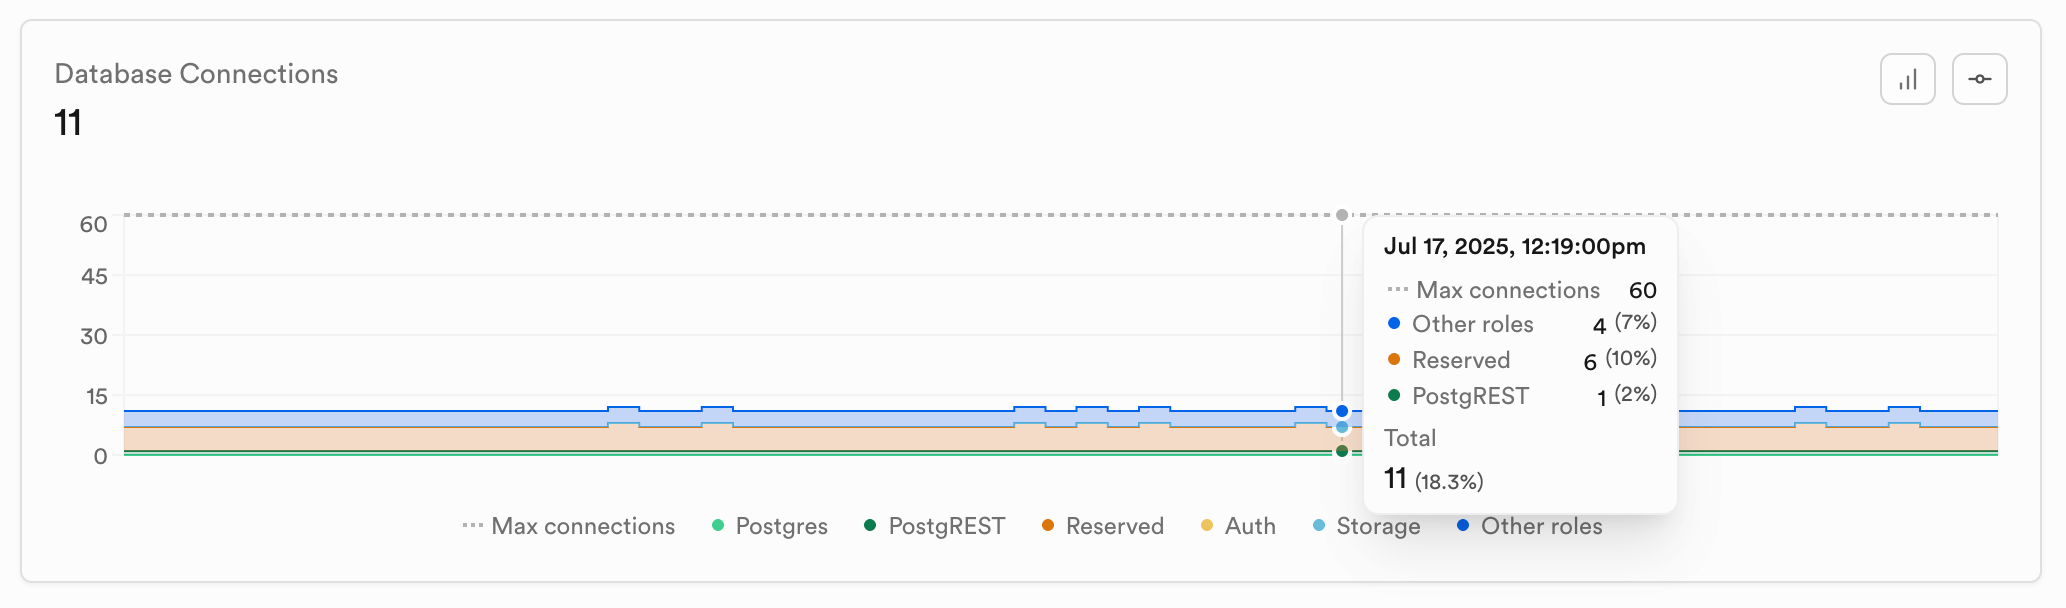
How it helps debug issues:
Actions you can take:
Dedicated Pooler (PgBouncer) Client Connections#
Available on Team and Enterprise plans.
This chart displays the number of PgBouncer connections over time.
How it helps debug issues:
Actions you can take:
Shared Pooler (Supavisor) Client Connections#
Available on Team and Enterprise plans.
This chart displays the number of Supavisor connections over time.
How it helps debug issues:
Actions you can take:
Disk Usage#
Database size#
How it helps debug issues:
Actions you can take:
Edge Functions#
The Edge Functions report provides insights into serverless function performance, execution patterns, and regional distribution across Supabase's global edge network.
PostgREST#
The PostgREST report provides insights into RESTful API performance, request patterns, and response characteristics.
Realtime#
The Realtime report tracks WebSocket connections, channel activity, and real-time event patterns in your Supabase project.
Realtime API Gateway#
The Realtime API Gateway reports focus on API requests related to Realtime functionality.
Storage#
The Storage report provides visibility into how your Supabase Storage is being used, including request patterns, performance characteristics, and caching effectiveness.